Nilambur Furniture
How 3 Strategic UX Changes Delivered 43% Conversion Growth
The Challenge
Nilambur Furniture, with over 500+ SKUs, was facing significant challenges that were impacting their conversion rates and customer satisfaction.
Product Discovery Crisis
Customers were overwhelmed by 500+ SKUs with no clear navigation or filtering system
Information Gaps
High volume of WhatsApp inquiries for basic product details indicated missing information
Purchase Friction
Customers showed interest but were dropping off during the purchase process
Baseline Issues
Low conversion rates and high customer service burden
User Experience
Suboptimal user journey on homepage and product pages
Our Strategic Approach
Data-Driven Analysis
Identified friction points in user behavior through comprehensive analytics review and user session recordings.
Customer Feedback Review
Addressed information gaps by analyzing customer inquiries and feedback patterns to understand pain points.
Conversion Funnel Optimization
Targeted specific drop-off points in the customer journey to maximize conversion potential.
3 Strategic UX Changes
1. Homepage: Popular Collections
- Problem: Decision overload with 500+ SKUs causing high bounce rates
- Solution: Implemented curated "Popular Collections" for easier product discovery
- Impact: Reduced bounce rates and significantly improved product discovery rates
2. Product Page: Tabular Description Format
- Problem: Inadequate product descriptions leading to customer confusion
- Solution: Converted descriptions to a clear, scannable table format with specifications
- Impact: Reduced customer inquiries and increased purchase confidence
3. Product Page: Sticky Add to Cart
- Problem: Missing Add to Cart button when users scrolled through long product pages
- Solution: Implemented sticky Add to Cart button visible during scrolling
- Impact: Reduced cart abandonment and captured more purchase intent
Exceptional Results Achieved
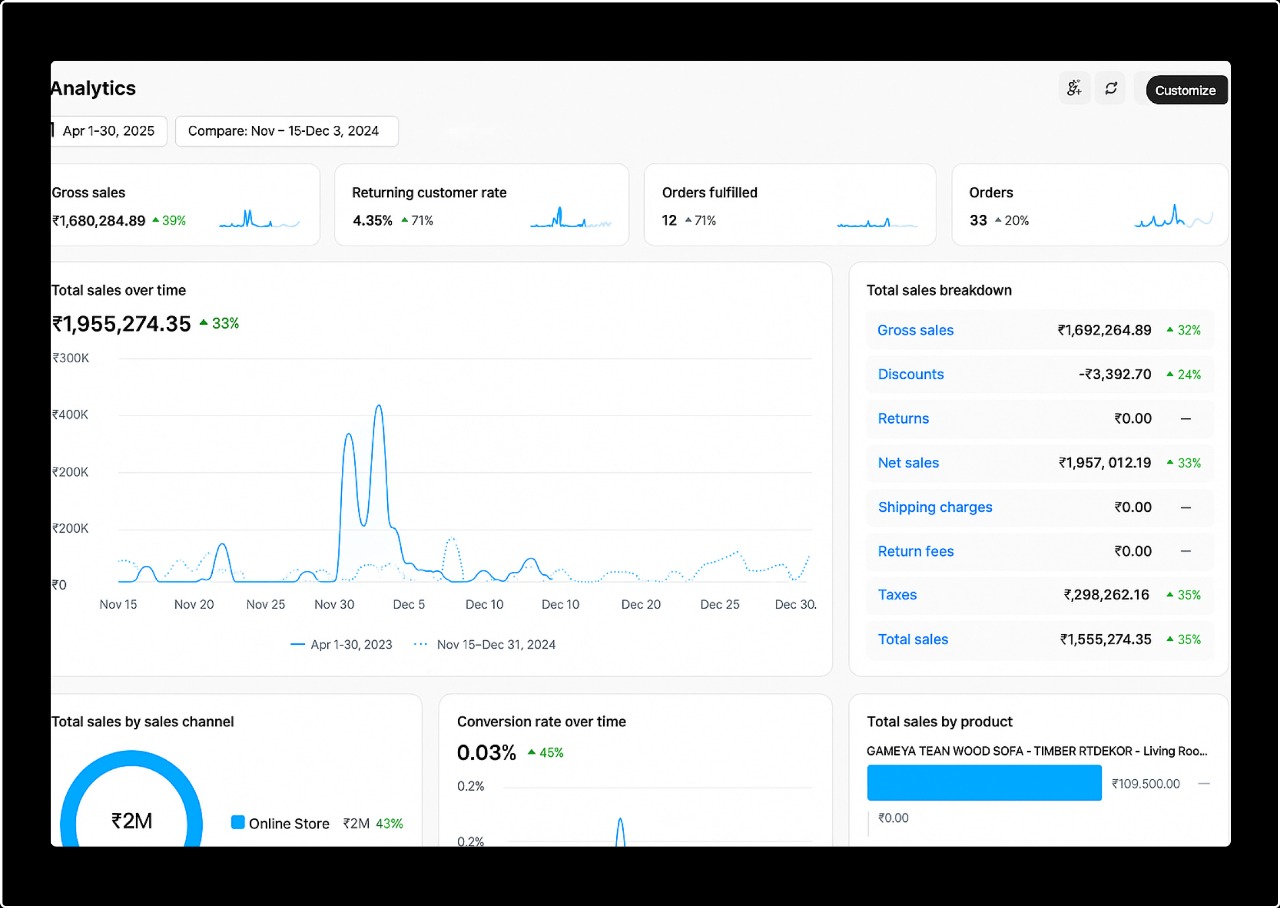
Analytics dashboard showing sustained 33% growth in revenue and improved conversion metrics
₹19,55,274
Total Revenue (↑33% growth)
₹16,92,264
Gross Sales (↑32% growth)
₹50,212
Average Order Value (↑66% growth)
0.03%
Conversion Rate (↑43% improvement)
33 Orders
Total Orders (↑20% growth)
45,697
Sessions (↑57% increase)
4.35%
Returning Customer Rate (↑71% improvement)
Sustained
Performance post-engagement with lasting results
Long-term Impact
The improvements continued post-engagement with April data showing sustained growth, proving the lasting effectiveness of our data-driven, user-centric CRO strategies. This case demonstrates how strategic UX changes can deliver measurable business results while reducing customer service burden.
Methodology & Tools
Analysis Tools
- Google Analytics for behavior tracking
- Heatmap analysis for user interaction patterns
- User session recordings
- Customer feedback analysis
Implementation Approach
- A/B testing for optimization validation
- Progressive rollout strategy
- Performance monitoring and iteration
- Conversion funnel optimization
Ready to Transform Your E-commerce Performance?
Let's discuss how strategic UX optimization can boost your conversion rates and revenue like we did for Nilambur Furniture.
Start Your Project